AA-1000: measurements at higher frequencies
Note 1: This article is related to AA-1000 only. Other RigExpert analyzers have different structure so this info may not be applied to them.
Note 2: The mode of operation described in this article is experimental and is neither supported nor guaranteed by the manufacturer.
Note 3: There is no “overclocking”, so your analyzer is safe when performing experiments described below.
However, it is possible to run the AA-1000 on 7th, 9th, 11th and 13th harmonics to extend the maximum operating frequency for the experiment. Of course, worse precision is expected, and calibration is absolutely needed for frequencies higher than 1000 MHz. Another limitation: this only works with AntScope, so the AA-1000 disconnected from a computer cannot be used at larger frequencies.
In this article I am focusing on simplicity, instead of getting maximum performance out of suggested methods. I am intentionally treating calibration standards as ideal ones, forgetting about the difference in their physical sizes, skin effect, etc.
First of all, open your RigExpert VHF Antenna Analyzer folder and find the AntScope.ini file. By using a text editor, make changes in the following section:
| [Limits] MaxFqAA1000=1000000000 |
Replace 1000000000 (maximum operating frequency in Hz) with a value up to 2600000000 (larger values simly will not work). Now when the AntScope is started, frequencies up to 2600 MHz are accessible.
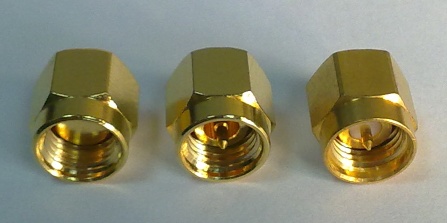
Let’s experiment with SMA “open”, “short” and “load” (50 Ohm) calibration standards (manufacturer is unknown), connected to the analyzer via an N-to-SMA adapter:
The SWR graph for the “load” (50 Ohm) is as follows:
A slant at lower frequencies (up to SWR=1.11 at 1000 MHz) is largely caused by a non-ideal N-to-SMA adapter. At higher frequencies, other effects take place, such as resonances in the resistive bridge, etc. This makes direct measurements impossible, and calibration is required. It should be noticed that a simple open-short-load calibration method is not ideal: it only helps to improve measurement results. As for the the above graph, the calibration algorithm just cannot work correctly at frequencies from approximately 2230 to 2330 MHz, so we cannot rely on calibration results in this range.
By using Configure – Save calibration menu of the AntScope program, measurement results were saved for the three (“open”, “short” and “load”) calibration standards.
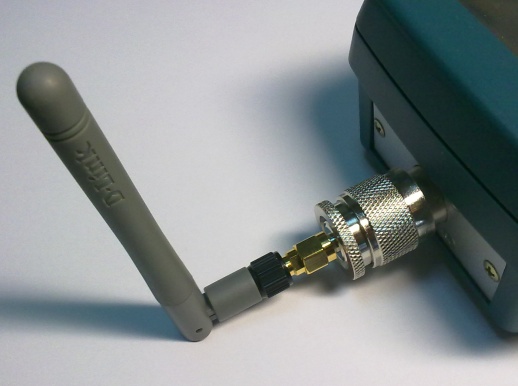
After this, a 2.4 GHz antenna (taken from a Wi-Fi router) was connected by using an SMA-to-RPSMA adapter:
Except for the 2230 to 2330 MHz range, the SWR graph looks almost like expected, showing resonance at approximately 2.4 GHz:
The above graph is very “noisy” and the results are not too preciese – but are not too bad.
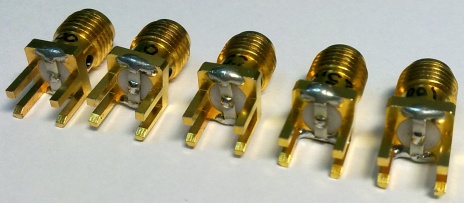
In the second experiment, a “home-made” set of calibrations standards was used, made of PCB-mount SMA sockets and 0805 resistors. In addition to “open”, “short” and “load” (50 Ohm), two other standards were made (25.5 and 100 Ohm):
The experiment is focused on frequencies up to 1400 MHz, which include the 23cm amateur band.
After saving calibration data for “open”, “short” and “load” (50 Ohm) standards, the 25.5 Ohm standard was measured. Here is the SWR graph:
Instead of SWR=1.96, the value of 2.2 is displayed at 1400 MHz. It is not really good, but the cost of the calibration standards is only a few bucks…
Here is the SWR graph for the 100 Ohm standard:
Again, not too bad. And, for sure, antennas for the 23cm amateur band may be adequately tuned and tested by using a cheap set of calibration standards.
Here is an SWR graph of a double bazooka antenna for 435 MHz, which can also work on 1.2 GHz:
Denis Nechitailov, UU9JDR
Last updated: 12.03.2012