はじめに
AA-30.ZEROは、柔軟性、低コスト、小型を希望する方が対象です。基板上のUSBコネクターやピンヘッダを無くしコストを抑えてます。これは、自作機に組込む測定心臓部として最適です。.ZEROの動作電圧はは5Vです(Arduino又はArduino互換ボード同様)。適正電圧のACアダプター接続し.ZEROの動作電圧が5Vなのを確認にしてください。
PCと.ZEROの接続
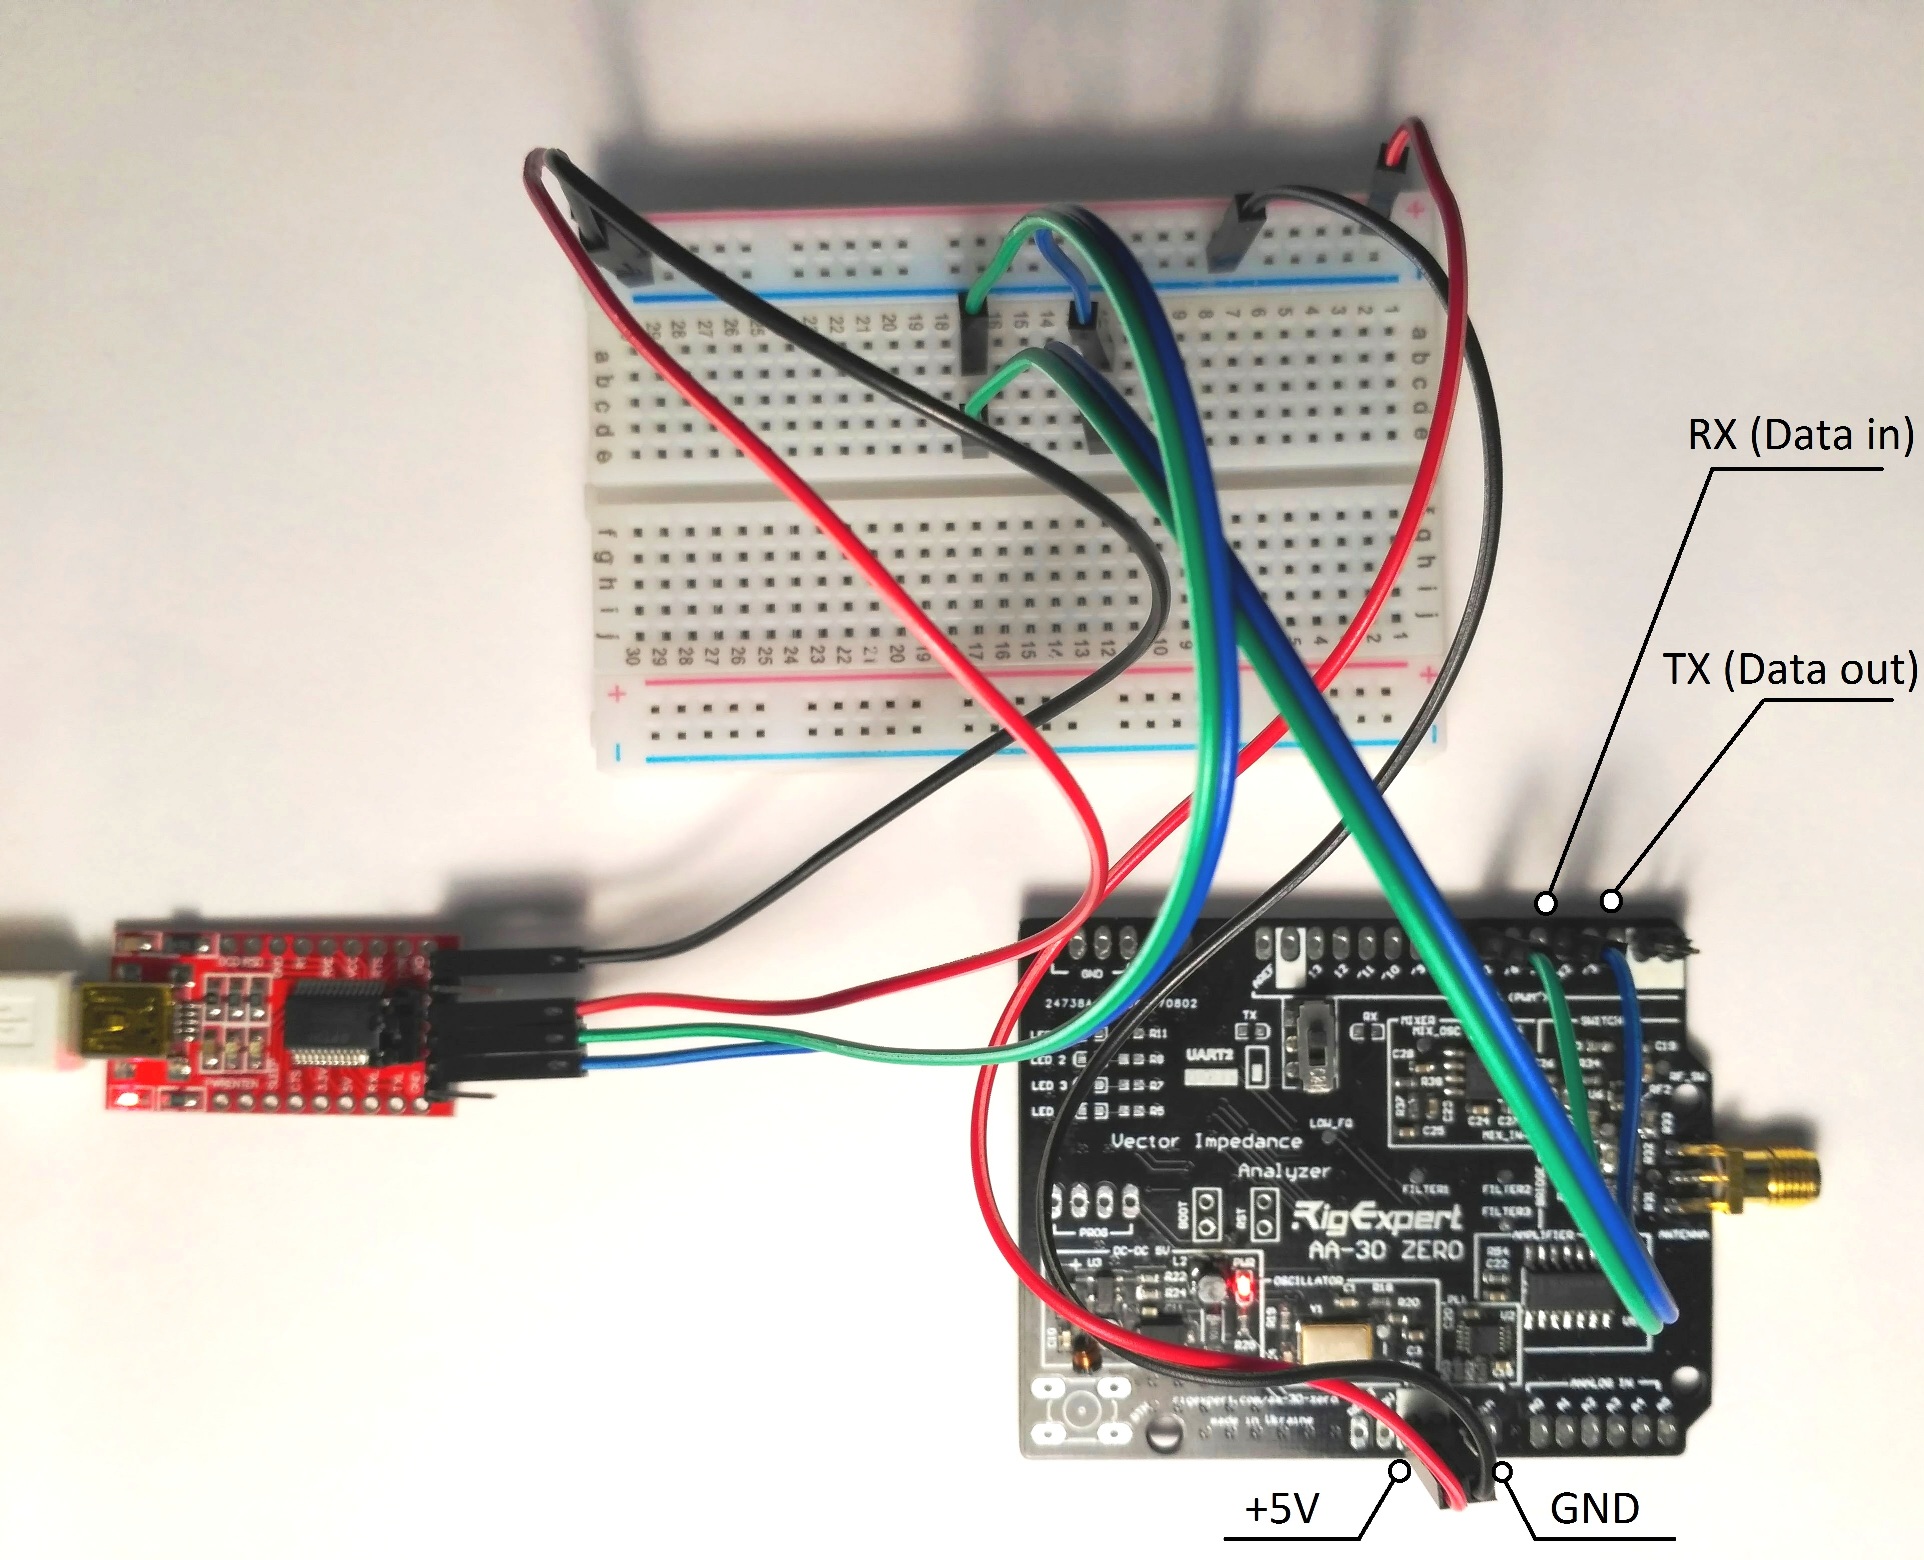
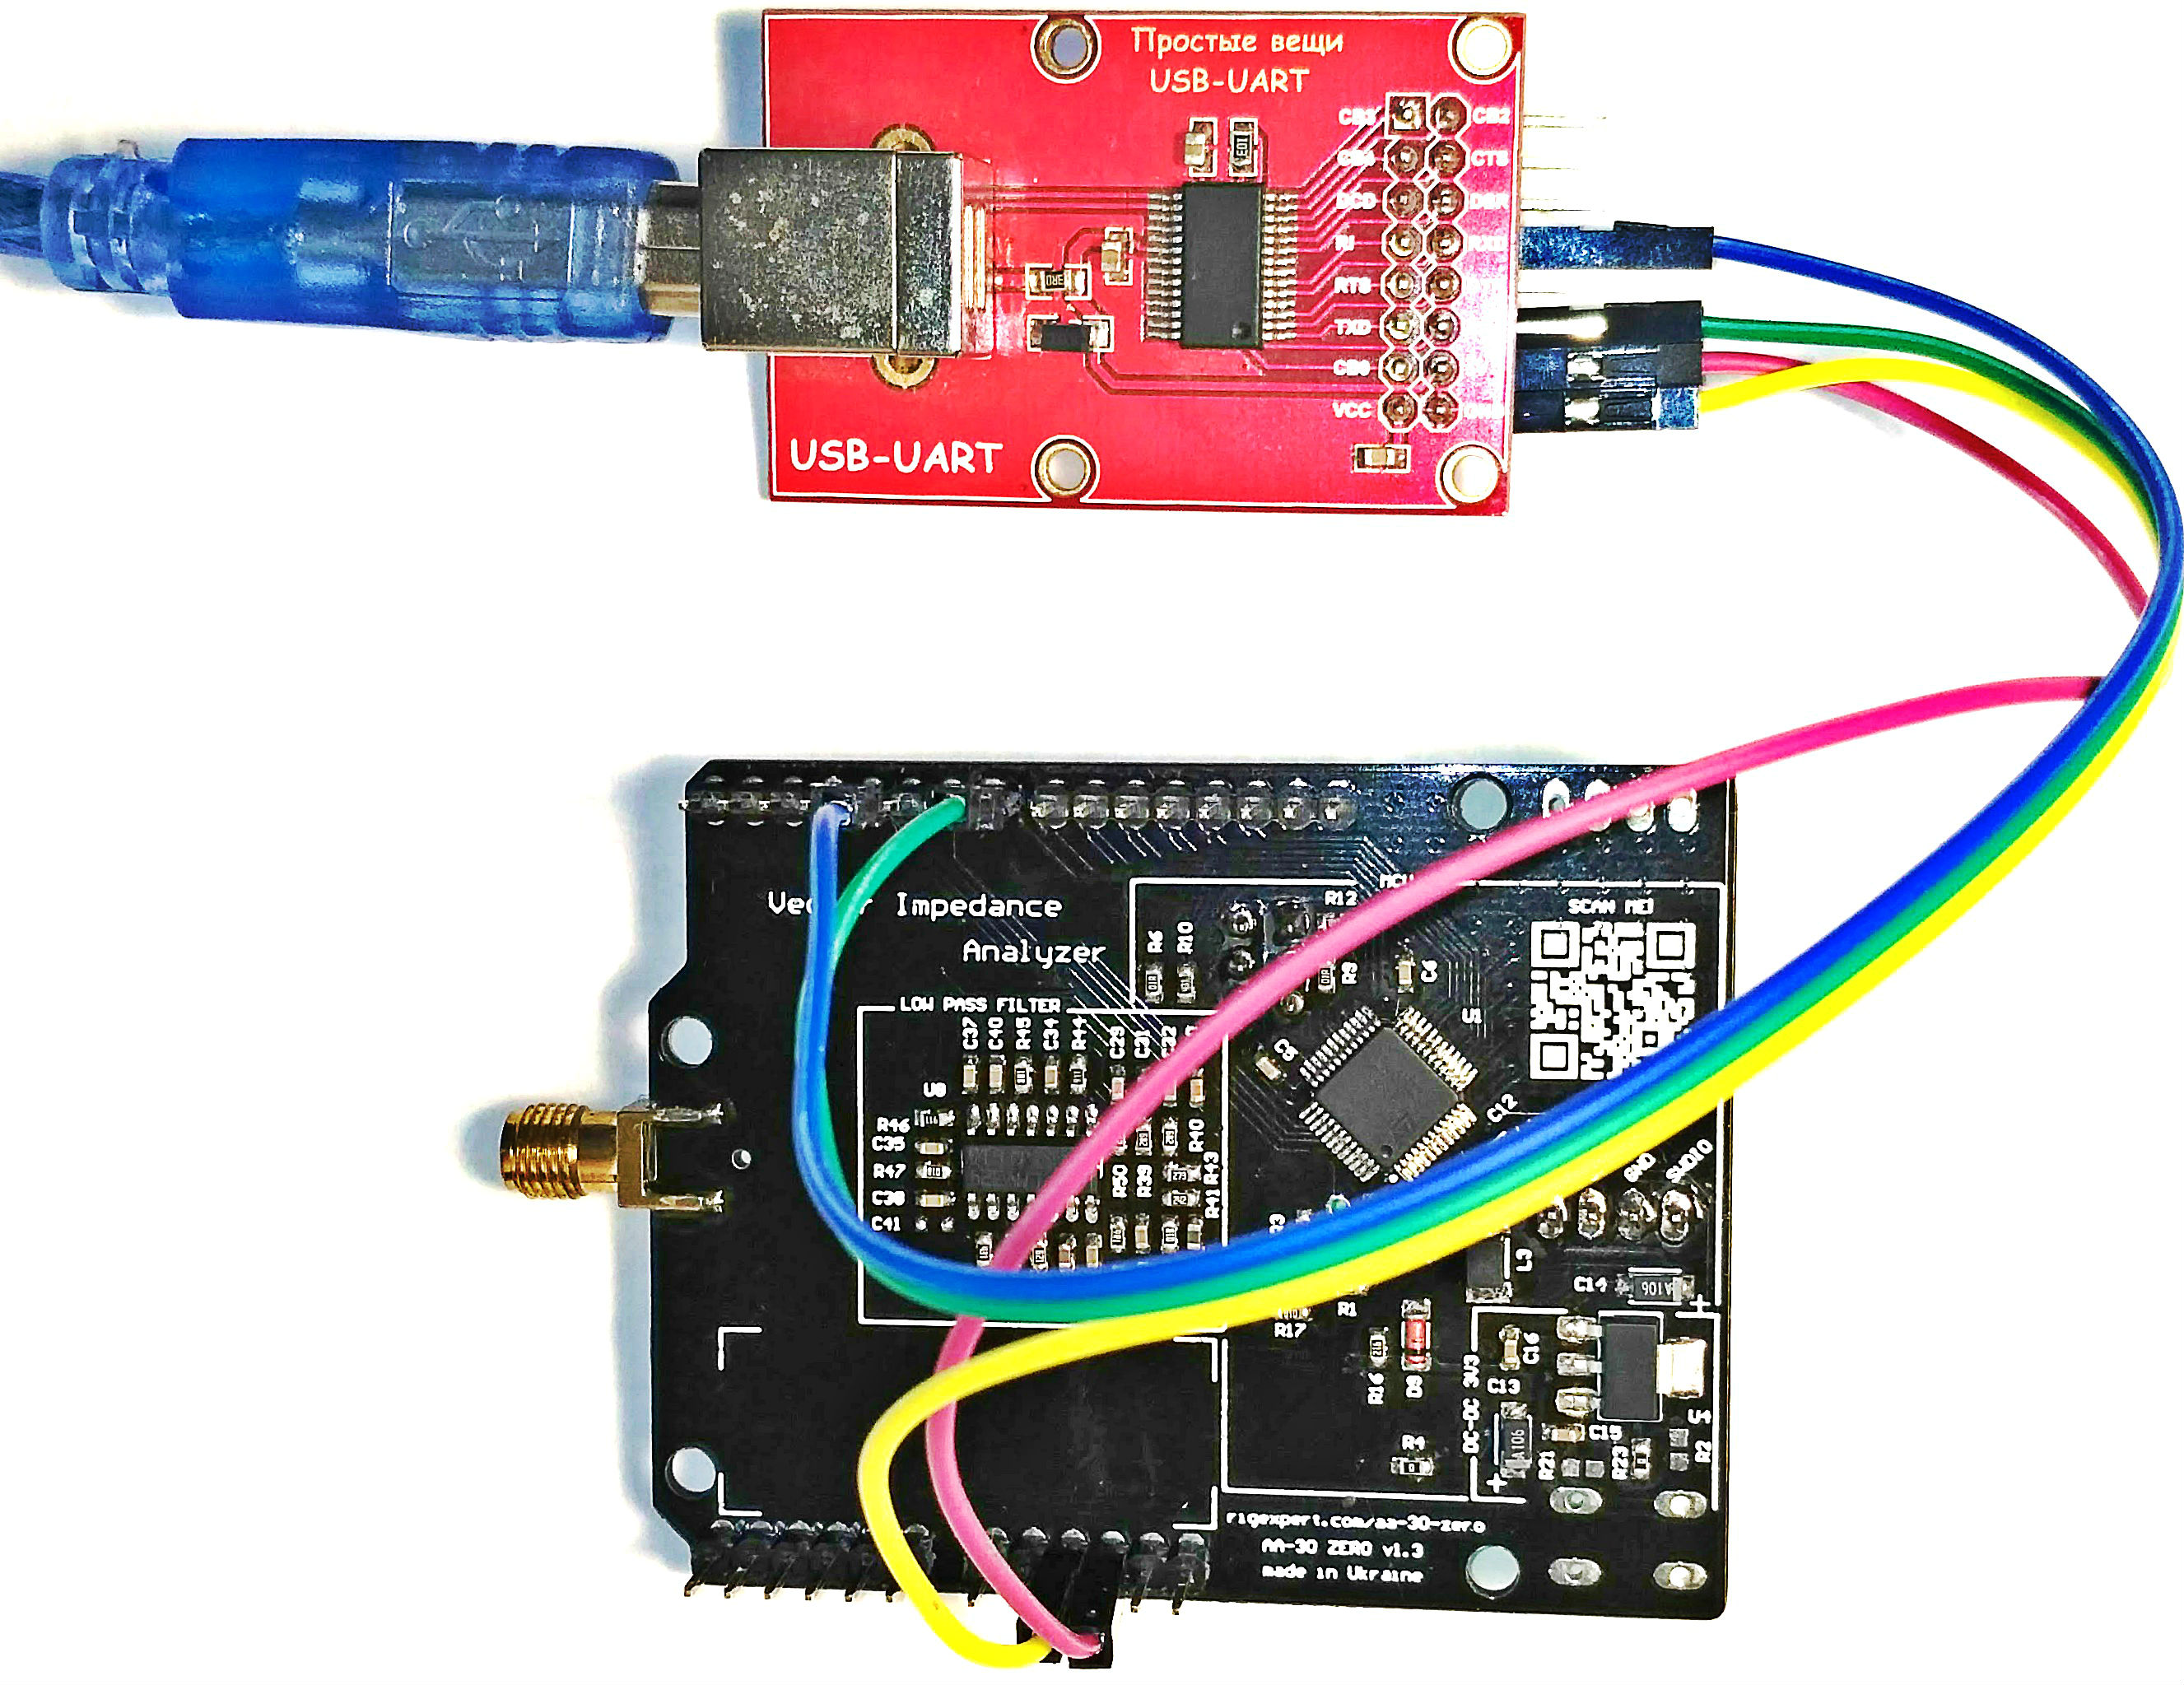
.ZEROはUSB回路を内蔵してないので、UARTインターフェースを介して外部デバイスと通信します。例えば、別売のUSB/TTLシリアルコンバータを下図の様に接続し.ZEROとPCの通信を可能にします。.ZEROには、UART1(ピン0 / TX1と2 / RX1)とUART2(ピン4 / TX2と7 / RX2)の2タイプのUARTインタフェースが用意されていますが、デフォルト接続はUART2インターフェイスです。USB/TTLシリアルコンバータの例としてSparkFun USB UARTシリアルブレークアウトをがあります。国内では秋月電子から同様のコンバータを取寄せ可能です。
図1 .ZEROとUSB2UARTアダプタの接続図

(接続例)色付き線材でUSB2UARTアダプターを.ZEROに接続。
手順:USBアダプタのTXピンを.ZEROのRXピンに接続し、USBアダプタのRX端子を.ZEROのTX端子に接続する。
次に、標準USBケーブルでUSB2UARTをPCに接続します。
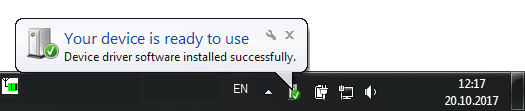
PCがUSB-UARTアダプタを認識し、ドライバが正しくインストールされていることを確認ください。
AntScopeソフトウェアのインストール
。ZEROによる測定には、AntScopeソフトウェア(以下AntScope)が必須です。AntScopeは、AA-30製品ページのソフトウェアインストーラ、又はこのリンク先からダウンロードできます。
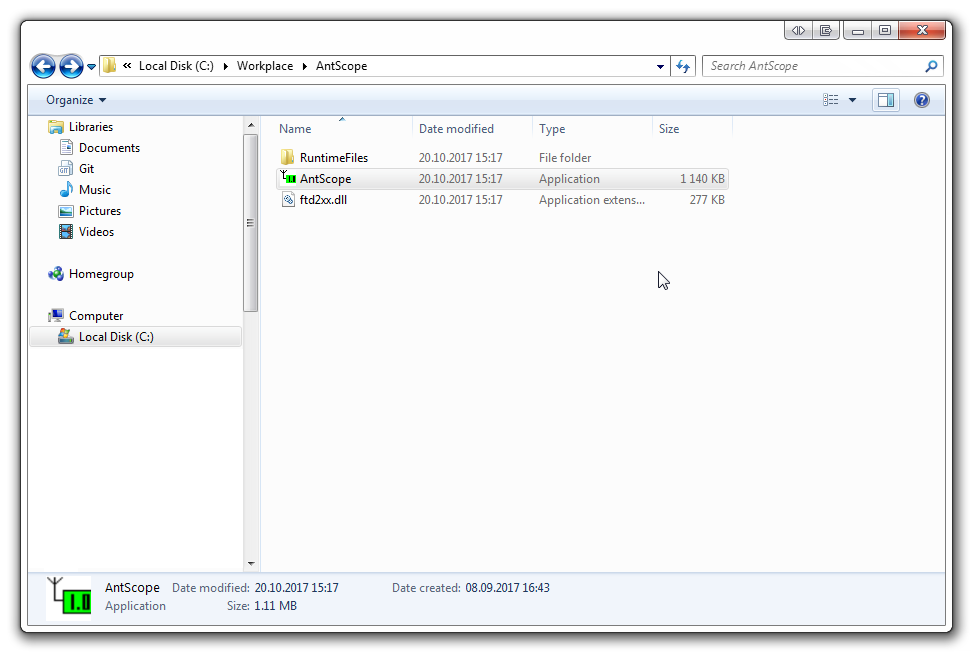
AntScopeをPCのデスクトップ(ダウンロード先は任意)にダウンロードした場合。デスクトップ(ダウンロード先)のAntScopexxx.zipファイルをダブルクリックして解凍し、 AntScope.exeを実行します。
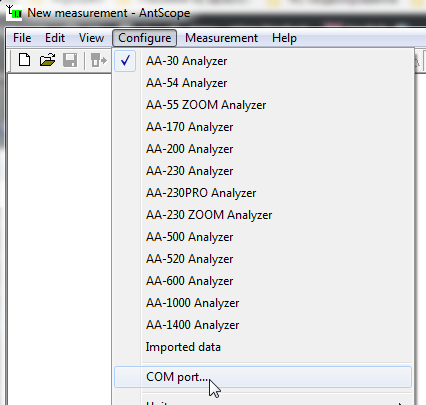
AntScopeは接続したAA-30.ZEROを自動検出しないことがあります。
その場合はメニューで接続デバイスタイプを手動選択しなくてはなりません。
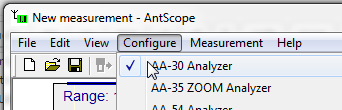
正しいCOMポートが選択されているのを確認してください。
おめでとう!これで最初の測定準備が整いました。
測定開始
最初に、測定対象とAA-30.ZEROをケーブル(変換コネクター)で接続します。
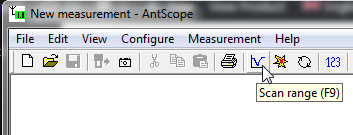
次に、メニューバーのすぐ下にある[Run Icon]をクリックします。
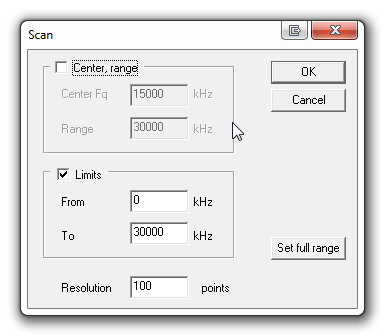
“Set full range”ボタンを押して “OK”ボタンを押してください。
.ZEROが点滅し始めます…
数秒後に測定結果が表示されます。
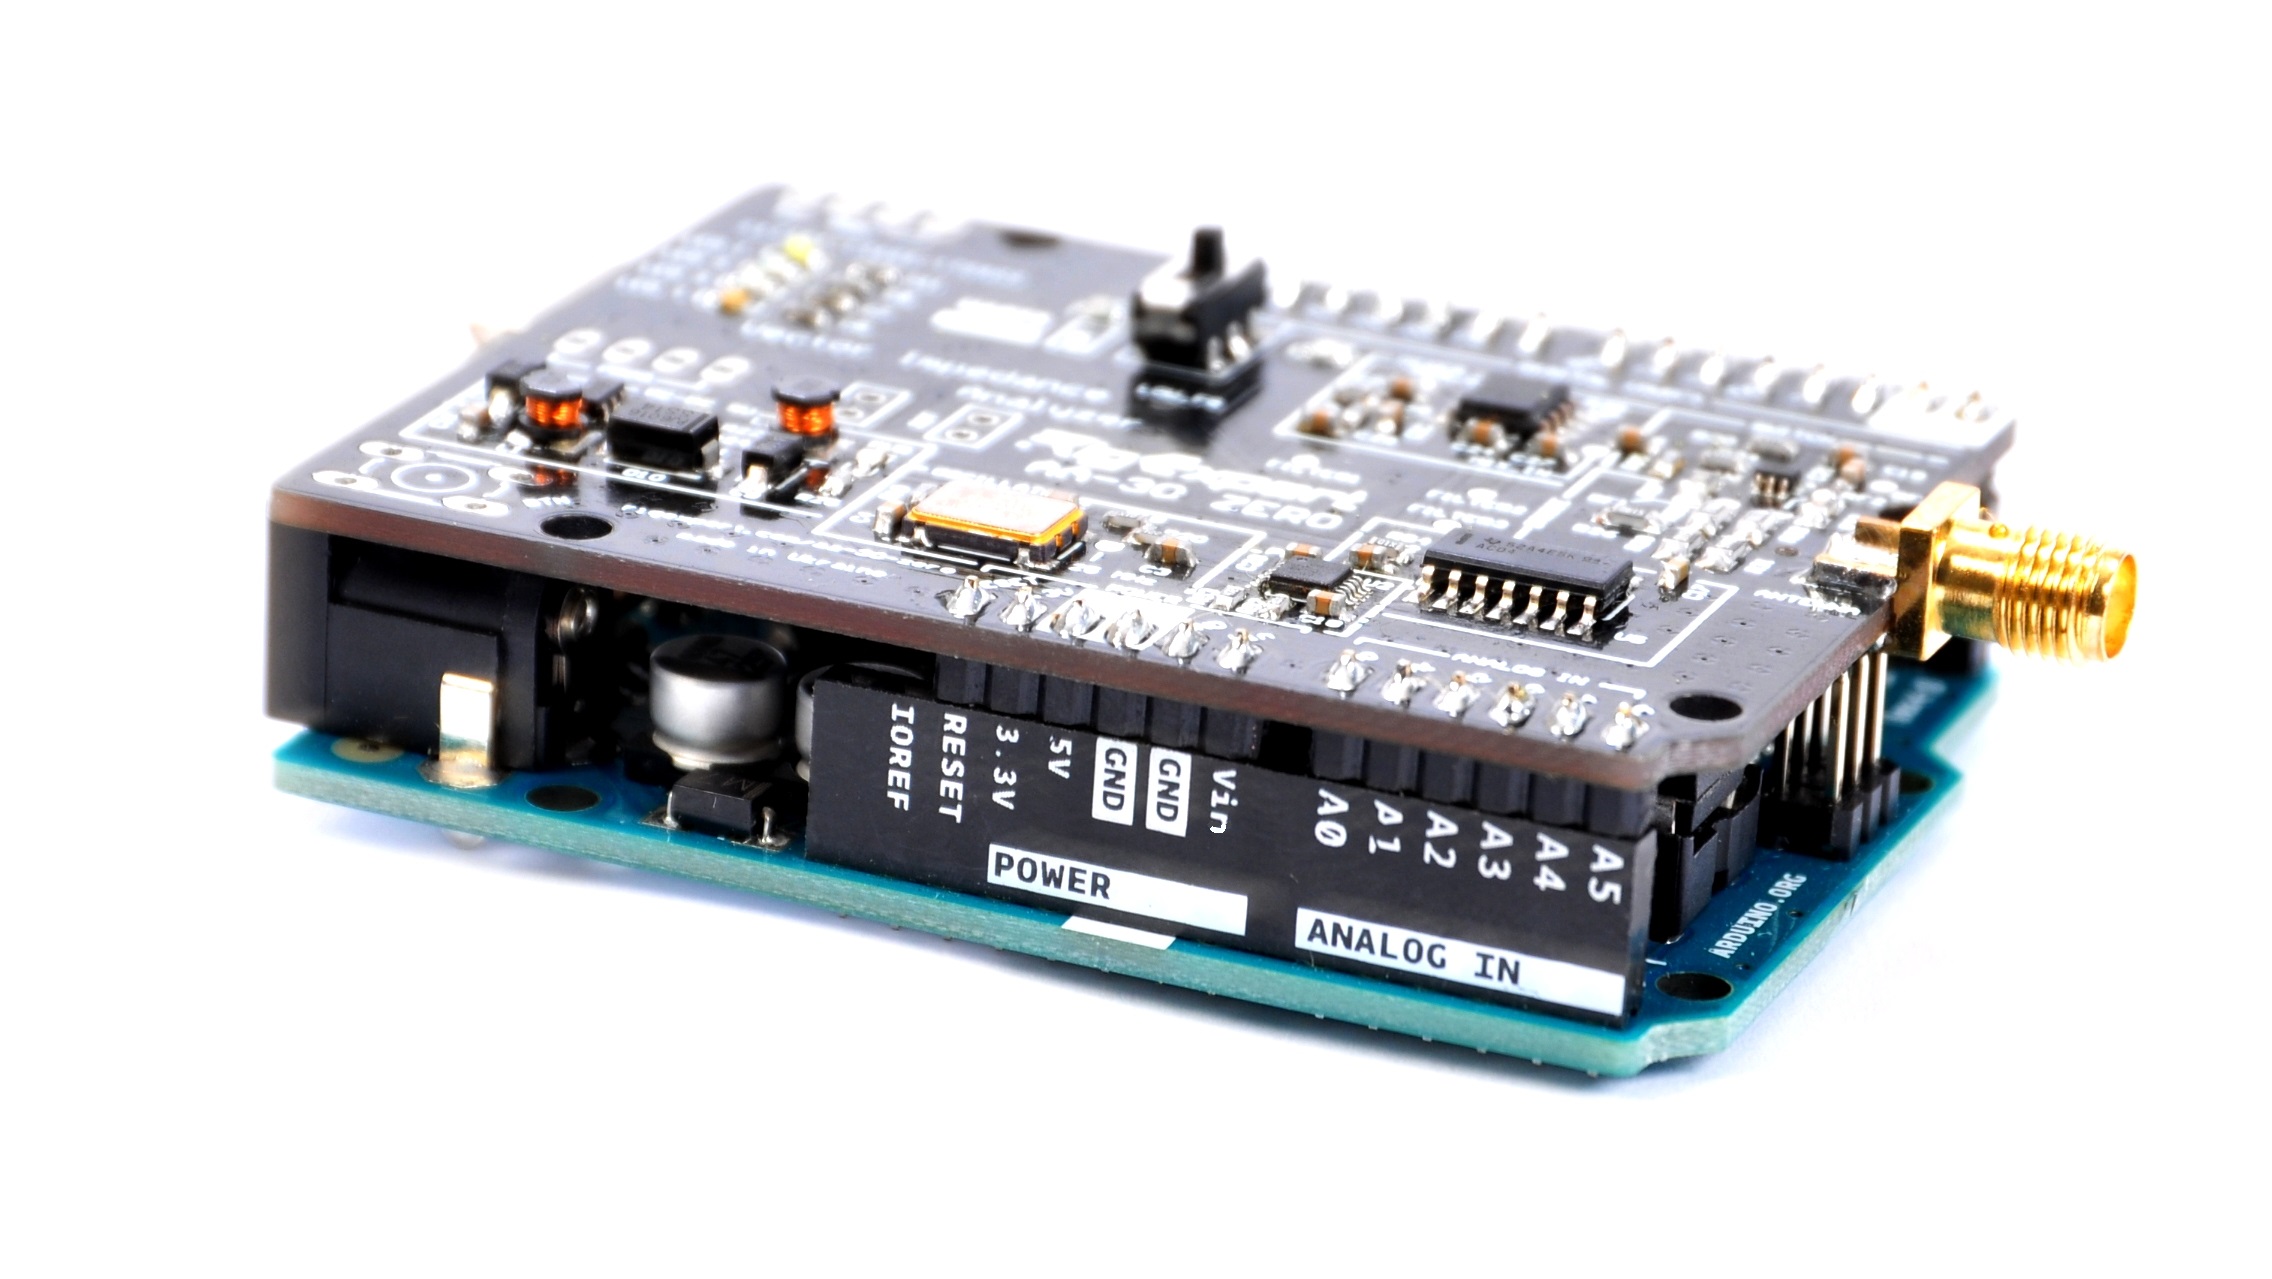
Arduino Unoと.ZEROの一体化
ヘッダーの半田付け
.ZEROに同梱されているピンヘッダー
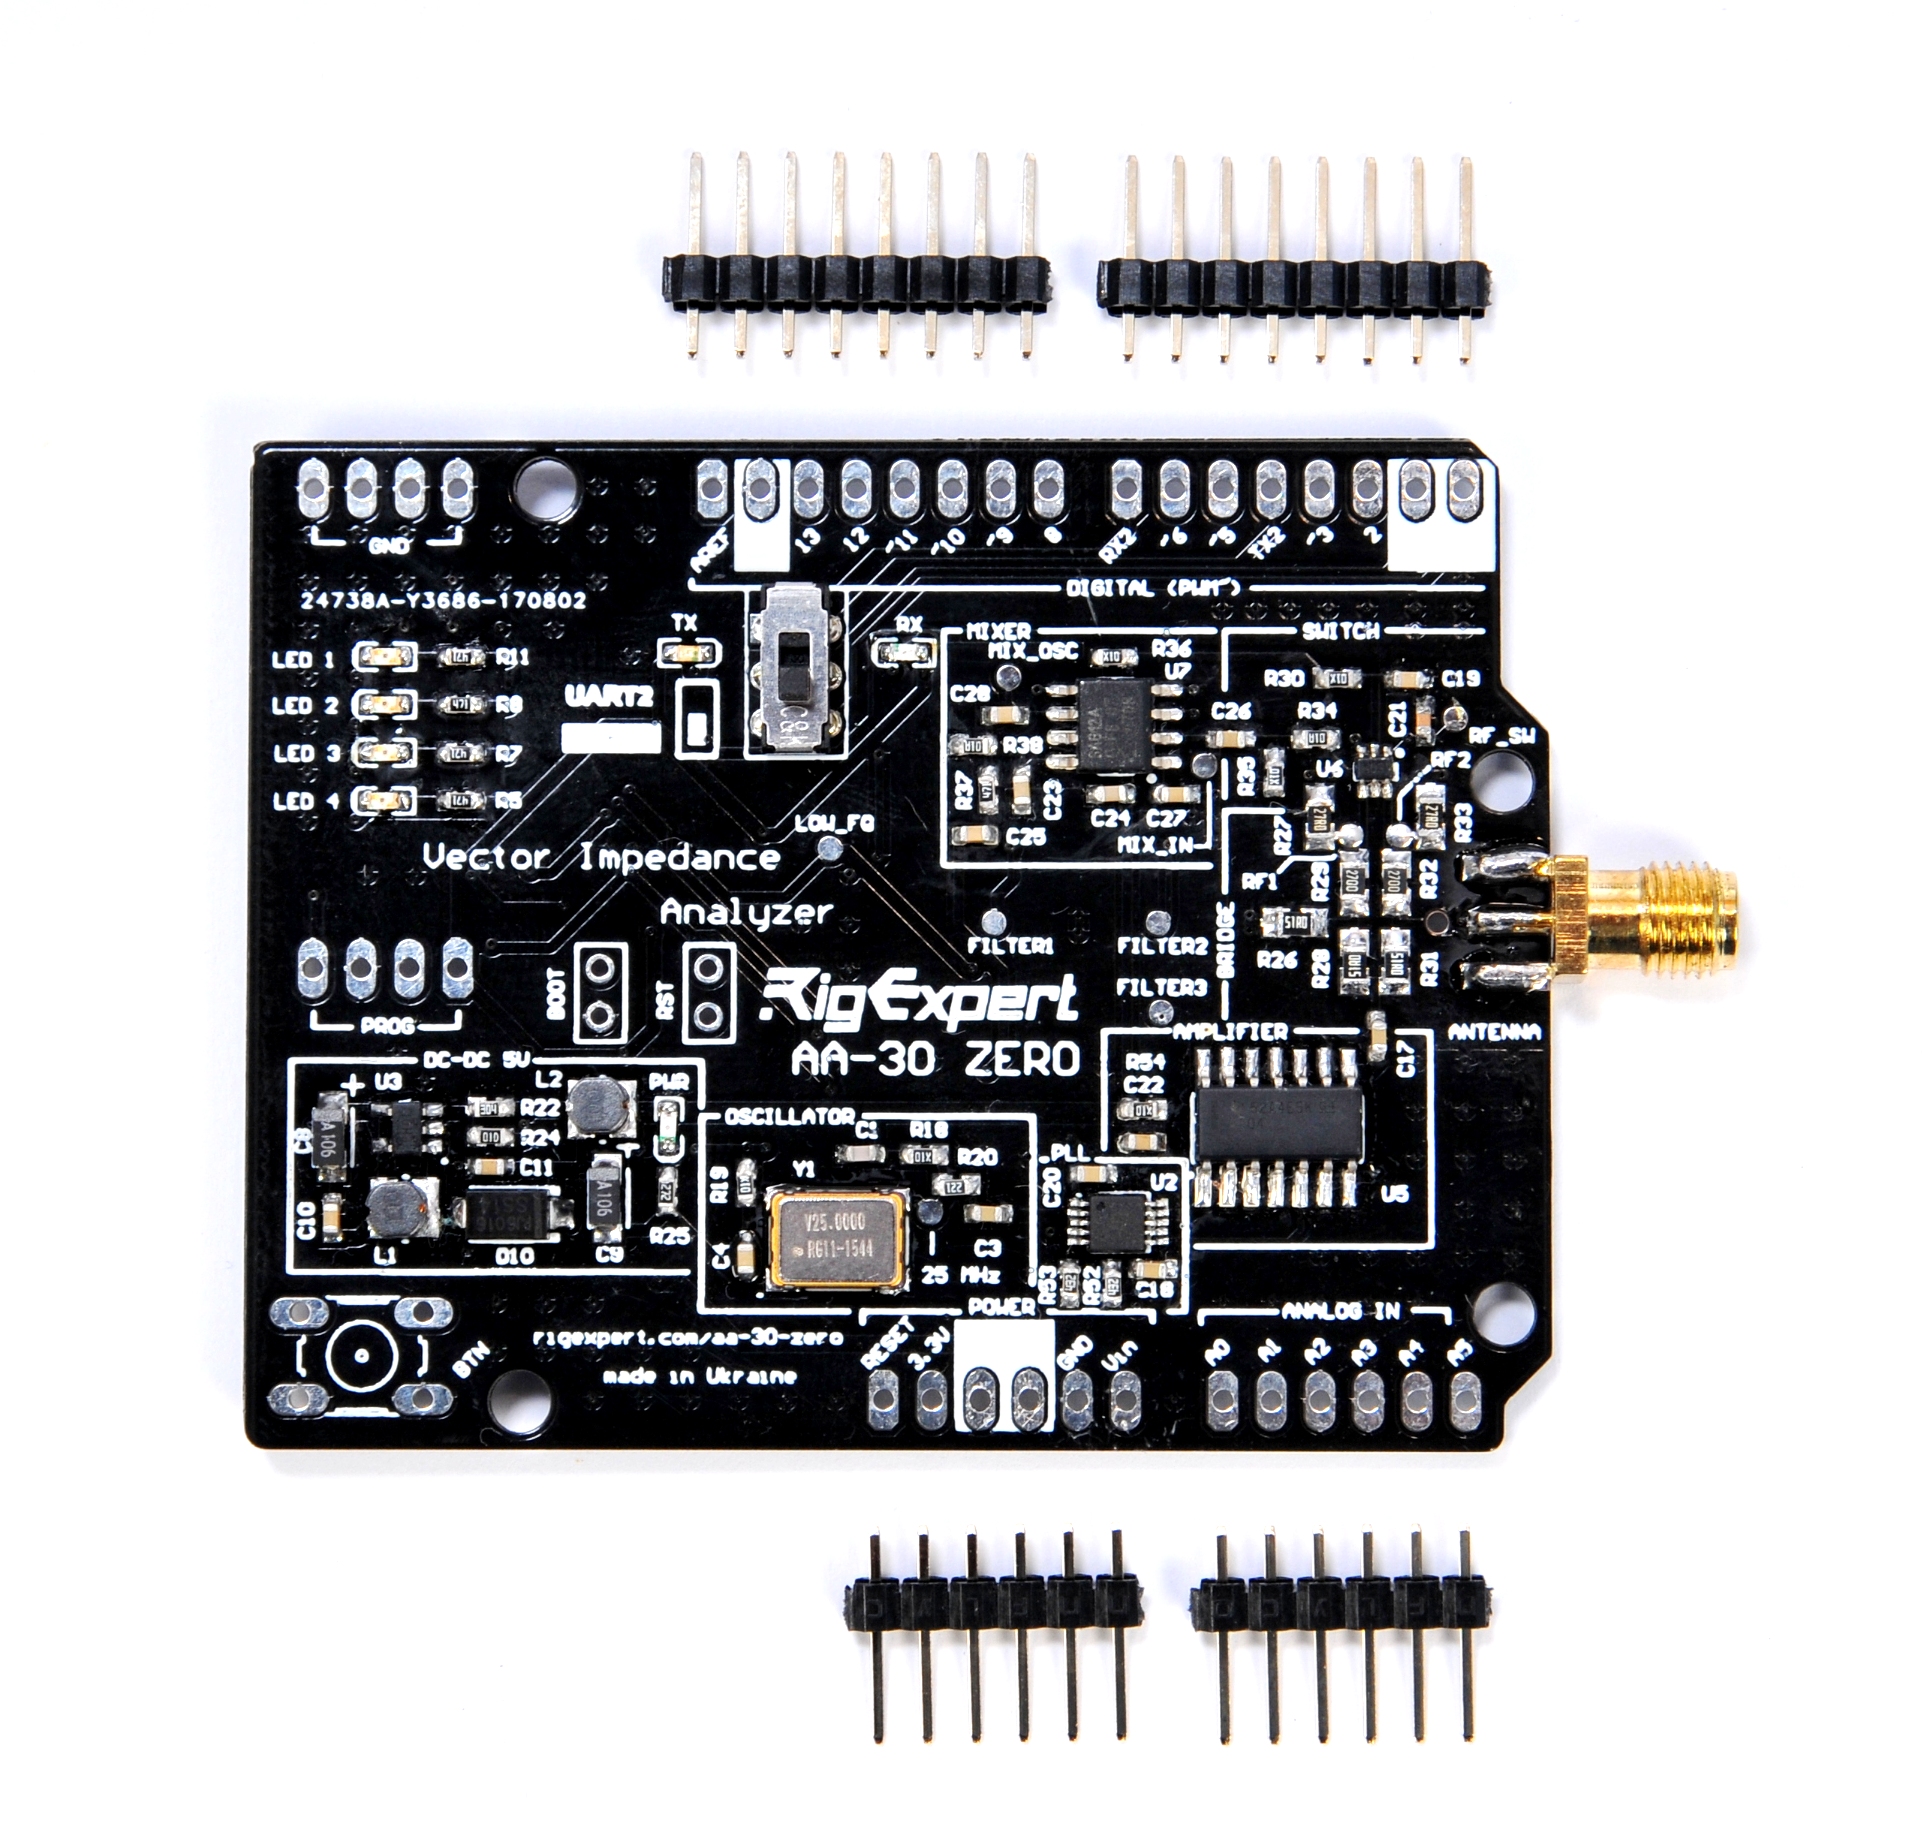
.ZEROとArduinoを一体化するには、.ZEROにピンヘッダーをハンダ付けした後ZERO側のピンをArduinoのソケットに差込みます。
ピンの割付
- D0 – UARTインタフェース1、TX、データ出力
- D1 – UARTインターフェース1、RX、データ入力
- D4 – UARTインターフェイス2、TX、データ出力
- D7 – UARTインタフェース2、RX、データ入力
ジャンパの位置選択でUART1/2インタフェースを選択できます。
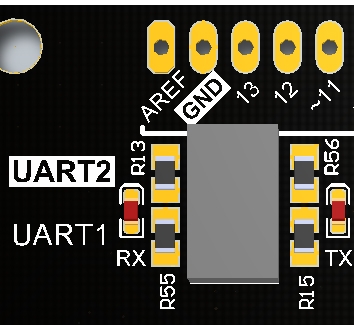
.ZEROのデフォルトはUART2インターフェースです。
Arduino IDEのインストールと最初のプロジェクトのコンパイル
Arduino IDEをダウンロードしインストールの後、Arduino上で簡単なスケッチをコンパイルして実行する必要があります。
// RigExpert AA-30 ZERO antenna & cable analyzer and Arduino Uno
//
// Receives from the Arduino, sends to AA-30 ZERO.
// Receives from AA-30 ZERO, sends to the Arduino.
//
// 26 June 2017, Rig Expert Ukraine Ltd.
//
#include <SoftwareSerial.h>
SoftwareSerial ZERO(4, 7); // RX, TX
void setup() {
ZERO.begin(38400); // init AA side UART
ZERO.flush();
Serial.begin(38400); // init PC side UART
Serial.flush();
}
void loop() {
if (ZERO.available()) Serial.write(ZERO.read()); // data stream from AA to PC
if (Serial.available()) ZERO.write(Serial.read()); // data stream from PC to AA
}
この簡潔な “シリアルリピータ“のコードは、コンピュータと.ZEROの双方向通信を可能にします。Arduinoはリピーターとして機能するので、任意のコードを実装して、コンピューターと.ZEROアナライザー間のデータ交換を適正化できます。
シリアル通信プロトコル
.ZEROはアマチュアの興味対象を具現化するデバイスなので、.ZEROのユーザーに出来るだけ自由度を提供できる様に配慮しました。以下のコマンドにより、アンテナとケーブルのパラメータを測定するだけでなく、電源投入直後から.ZEROが繰返し測定を自動実行できるようになります。この機能は、機器がより複雑なシステムの一部である場合(例えばアンテナチューナー)に便利です。
通信プロトコル
| Command | Description | Response |
|---|---|---|
| ver | returns analyzer type and firmware version | AA-30 ZERO XXX |
| fqXXXXXXXXX | set center frequency to XXXXXXXXX Hz | OK |
| swXXXXXXXXX | set sweep range to XXXXXXXXX Hz | OK |
| frxNNNN | perform NNNN measurements in the specified range | output frequency (MHz), R and X for every meqasurement |
例:
SW1000000\r\n
FRX10\r\n
14.000000,58.84,17.28\r\n
14.100000,69.74,16.79\r\n
14.200000,68.52,5.62\r\n
14.300000,62.49,2.79\r\n
14.400000,57.51,4.62\r\n
14.500000,55.38,9.11\r\n
14.600000,56.52,13.56\r\n
14.700000,59.40,17.41\r\n
14.800000,64.12,20.05\r\n
14.900000,71.13,22.01\r\n
15.000000,81.57,21.63\r\n
データの視覚化
測定結果を視覚化する最も簡単な方法は、独自のアプリケーションを作成することです。🙂
Install Processing IDE
この方法で、まずProcessing IDEをダウンロードしてインストールします。IDEソフトウェアをインストールしたら、この簡単なスケッチをコンパイルしましょう。
// For RigExpert AA-30 ZERO antenna & cable analyzer with Arduino Uno
//
// Receives data from AA-30 ZERO and makes a surface
// which is a visualization of SWR as a function of time
//
// 26 June 2017, Rig Expert Ukraine Ltd.
//
import processing.serial.*;
Serial ZERO;
int step; // Communication protocol steps (0 - set Freq; 1 - set Range; 2 - start measurements)
int maxSamples = 100; // Number of point to measure
int maxSets = 50; // Time depth
float points[][]; // Measurements data
int sample; // current sample
int set; // current data set
int colors[]; // curve color
int total; // total samples acquired
boolean ready; // screen redrawn if True
int Frequency; // current Frequensy
int Range; // current Range
// Code to send command to Analyzer
void serialize(String cmd) {
int len = cmd.length();
int charPos = 0;
while (len-- != 0) {
ZERO.write(cmd.charAt(charPos));
charPos++;
}
}
// SWR computation function
// Z0 - System impedance (i.e. 50 for 50 Ohm systems)
// R - measured R value
// X - measured X value
float computeSWR(float Z0, float R, float X) {
float SWR, Gamma;
float XX = X * X;
float denominator = (R + Z0) * (R + Z0) + XX;
if (denominator == 0) {
return 1E9;
} else {
float l = (R - Z0) * (R - Z0);
float t = (l + XX);
t = t / denominator;
Gamma = sqrt(t); // always >= 0
// NOTE:
// Gamma == -1 complete negative reflection, when the line is short-circuited
// Gamma == 0 no reflection, when the line is perfectly matched
// Gamma == +1 complete positive reflection, when the line is open-circuited
if (Gamma == 1.0) {
SWR = 1E9;
} else {
SWR = (1 + Gamma) / (1 - Gamma);
}
}
// return values
if ((SWR > 200) || (Gamma > 0.99)) {
SWR = 200;
} else if (SWR < 1) {
SWR = 1;
}
return SWR;
}
void setup() {
Frequency = 115000000;
Range = 230000000;
sample = 0;
set = -1;
step = 0;
points = new float[maxSets + 1][maxSamples + 1];
colors = new int[maxSets + 1];
ready = false;
total = 0;
background(0);
stroke(120, 240, 255, 255);
strokeWeight(1);
size(640, 480, P3D);
printArray(Serial.list());
// Replace COM name with one that matches your conditions
ZERO = new Serial(this, "COM21", 38400);
ZERO.bufferUntil(13);
delay(1000);
serialize("SW0\r\n");
}
void drawSurface() {
ready = false;
lights();
float sp = 0.001 * frameCount;
camera((width / 3) * sin(sp), 0, 800, width / 2, height / 2, 0, 0, 1, 0);
background(0, 0, 0);
textSize(30);
fill(255, 255, 255);
// ---------------- Axis ---------------------
stroke(255, 255, 255, 128);
line(0, height, 0, width, height, 0);
line(0, 0, 0, 0, height, 0);
line(width, 0, 0, width, height, 0);
line(0, height, 5 * maxSets, 0, height, 0);
line(width / 2, height, 5 * maxSets, width / 2, height, 0);
line(width, height, 5 * maxSets, width, height, 0);
// ---------------- Freq. markers ----------------
stroke(255, 255, 255, 128);
line(width / 2, 0, 0, width / 2, height, 0);
textAlign(CENTER);
text(Frequency / 1E3 + " kHz", width / 2, height, 5 * maxSets);
text(((Frequency / 1E3) - (Range / 2E3)) + " kHz", 0, height, 5 * maxSets);
text(((Frequency / 1E3) + (Range / 2E3)) + " kHz", width, height, 5 * maxSets);
// ----------------- Mode title ------------------
textAlign(LEFT);
textSize(36);
text("SWR as a function of time Graph", 0, -100, 0);
textSize(30);
if (mouseY < height / 5) {
if (mouseX < width / 2) {
fill(255, 0, 0);
textAlign(RIGHT);
text("F = " + Frequency / 1E3 + " kHz", width / 2 - 50, -50, 0);
fill(255, 255, 255);
textAlign(LEFT);
text("Range = " + Range / 1E3 + " kHz", width / 2 + 50, -50, 0);
} else {
fill(255, 255, 255);
textAlign(RIGHT);
text("F = " + Frequency / 1E3 + " kHz", width / 2 - 50, -50, 0);
fill(255, 0, 0);
textAlign(LEFT);
text("Range = " + Range / 1E3 + " kHz", width / 2 + 50, -50, 0);
}
} else {
fill(255, 255, 255);
textAlign(RIGHT);
text("F = " + Frequency / 1E3 + " kHz", width / 2 - 50, -50, 0);
textAlign(LEFT);
text("Range = " + Range / 1E3 + " kHz", width / 2 + 50, -50, 0);
}
// Get extremums
float minV = 1E9;
float maxV = -1E9;
for (int i = 0; i < set; i++) {
for (int j = 0; j < maxSamples + 1; j++) { if (points[i][j] > maxV) maxV = points[i][j];
if (points[i][j] < maxV) minV = points[i][j];
}
}
println("Min = " + minV + "; Max = " + maxV);
minV = 1;
if (maxV < 2) maxV = 2;
else if (maxV < 5) maxV = 5;
else if (maxV < 10) maxV = 10;
else maxV = 100;
float hK = width / maxSamples;
float vK = height / (maxV - minV);
float zK = 2;
// ----------------- Draw horizontal markers -----------------
fill(255, 255, 255);
textAlign(RIGHT);
line(0, height - vK, 0, width, height - vK, 0); // SWR = 2
text("SWR = 2.0", 0, height - vK, 0);
line(0, height - 2 * vK, 0, width, height - 2 * vK, 0); // SWR = 3
text("SWR = 3.0", 0, height - 2 * vK, 0);
line(0, height - 4 * vK, 0, width, height - 4 * vK, 0); // SWR = 5
text("SWR = 5.0", 0, height - 4 * vK, 0);
// Plot the lines
for (int i = 0; i < set; i++) {
if (colors[i] % 5 == 0) stroke(255, 0, 0, 255 * i / set);
else stroke(120, 240, 255, 255 * i / set);
for (int j = 1; j < maxSamples + 1; j++) {
// draw only if SWR < 100.0
if (points[i][j - 1] < 100) { line((j - 1) * hK, height - (points[i][j - 1] - 1) * vK, i * zK, j * hK, height - (points[i][j] - 1) * vK, i * zK); } } } } void draw() { if (ready) { drawSurface(); } } // Process incoming data void serialEvent(Serial p) { String inString; inString = p.readString(); if (inString.indexOf("OK") >= 0) {
switch (step) {
case 0: serialize("FQ" + Frequency + "\r\n");
step = 1;
break;
case 1: serialize("SW" + Range + "\r\n");
step = 2;
break;
case 2: serialize("FRX"+ str(maxSamples) + "\r\n");
step = 0;
sample = 0;
if (set == maxSets) {
// shift curves back
for (int i = 1; i < maxSets + 1; i++) {
colors[i - 1] = colors[i];
for (int j = 0; j < maxSamples + 1; j++) {
points[i - 1][j] = points[i][j];
}
}
} else {
set++;
}
colors[set] = total++;
ready = true;
break;
}
} else {
float[] nums = float(split(inString, ','));
if (nums.length == 3) {
float SWR = computeSWR(50, nums[1], nums[2]);
points[set][sample] = SWR;
sample++;
}
}
}
// Change Frequency & Range values by the Mouse Wheel
void mouseWheel(MouseEvent event) {
float e = event.getCount();
if (mouseY < height / 5) {
if (mouseX < width / 2) { // Change Freq. if (Frequency > 1E5) {
Frequency += e * 100000;
drawSurface();
}
} else {
// Change Range
if (Range > 1E5) {
Range += e * 1E5;
drawSurface();
}
}
}
}
重要な注意点
ここで使用されている正しいCOM番号を確認してください。
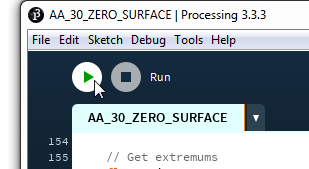
処理スケッチの実行
IDEエディタにコピーされたスケッチの後、RUNボタンを押します。
しばらくすると測定結果が画面に表示されます。
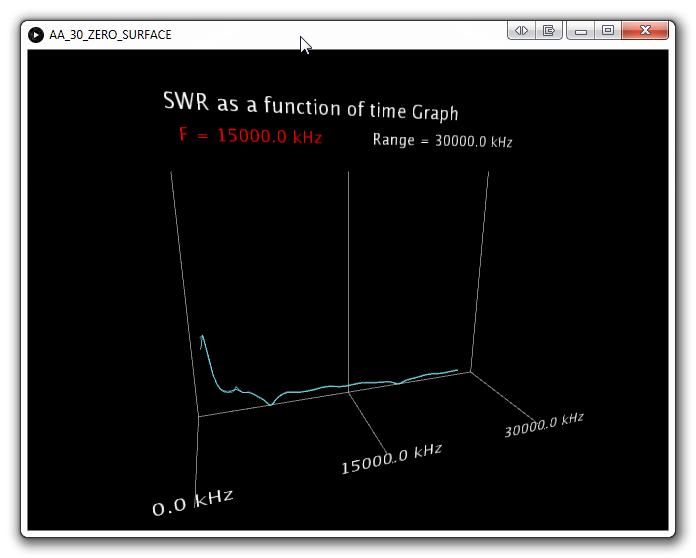
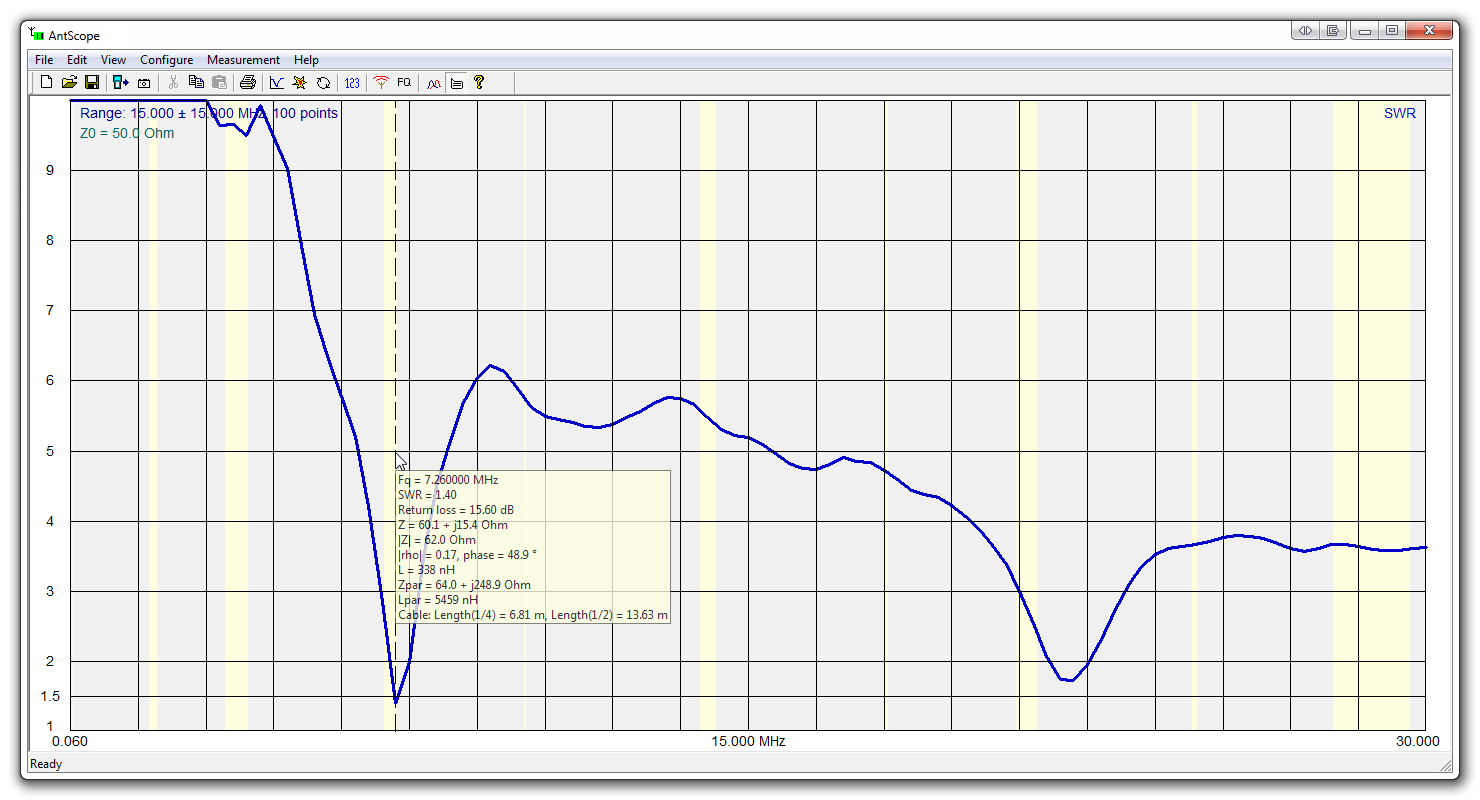
結果の図をAntScopeで描かれたグラフと比較してみましょう。
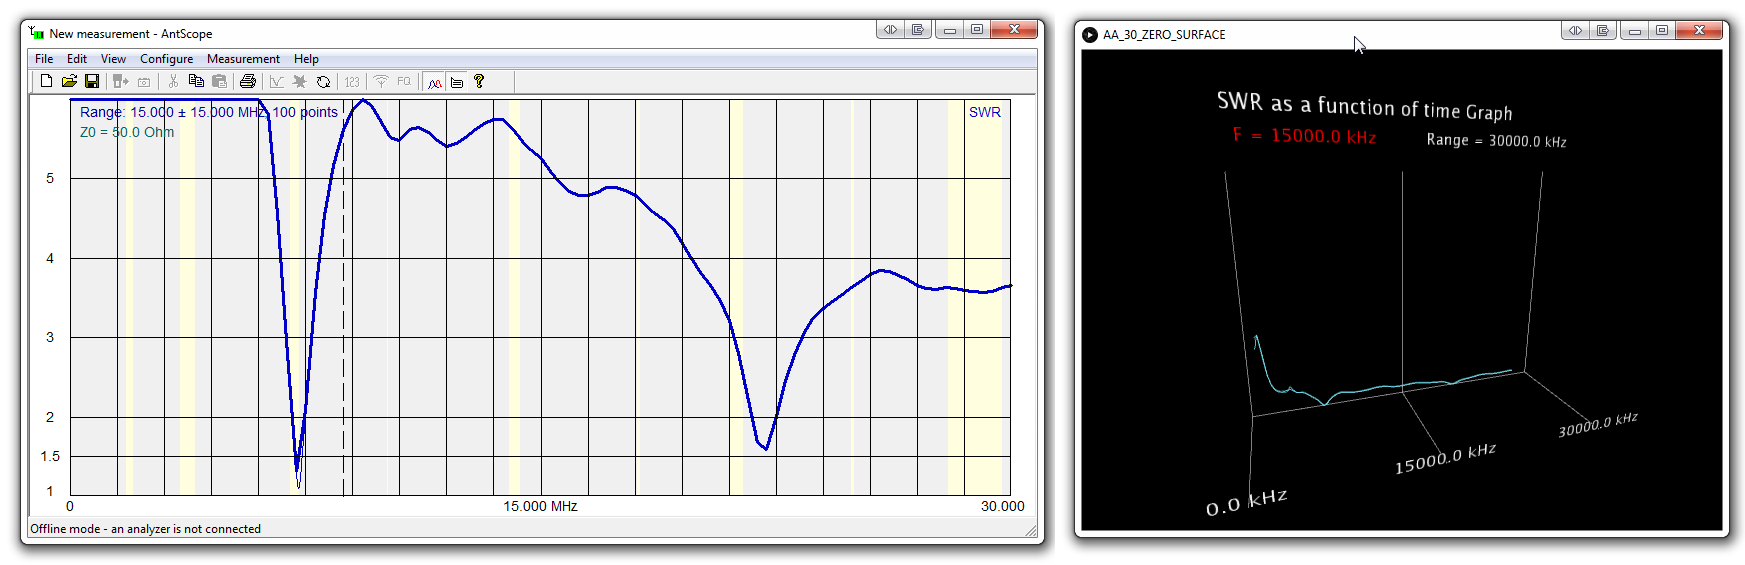
100%の類似性を得るには、対数スケールする必要があります。
ソースファイル
GitHub repositoryからソースファイルをダウンロードできます。
つづく…